Rarely one letter stirs up so much passion as ‘n’ in statistical research. Sample size is given considerable attention and a research with tens of thousands of responses is valued highly and considered to be absolutely reliable. A research with a few hundred respondents may be considered suspicious and the results may be (conveniently) ignored as nonsense or just a poorly selected sample. Whether the population size is a few hundred units or hundreds of thousands of units or whether statistically significant results are achieved does not seem to matter in these images.
When cross-tabulating and analyzing small subsets of collected data more data is obviously needed, but even then relevant results can be found on a much smaller n than usually imagined. For example, when comparing groups with more than 500 samples, statistical tests will essentially become obsolete. Virtually any difference is statistically significant. It shouldn’t be neglected, however, that this difference might not be relevant in any way. Interpreting these results might even be misleading. Reliable does not equal valid or relevant.
What is a relevant sample size?
Perhaps sample size should be approached with a slightly more open mind than just from the viewpoint of scientific accuracy. A researcher should always consider what is relevant for the research at hand. Of course it is understandable that, for example, in medical research or when monitoring manufacturing process of a large factory, margins of error should be extremely small. Even small errors can cause large damage to health or business. However, when researching already inaccurate phenomena, such as customer behavior, accuracy of the results just does not carry the same importance. When looking at people's intentions, opinions and other business issues, its more important to focus on relationship between different factors, observed trends and changes in these.
Sample size vs. Question formulation
What makes criticism of a small sample size particularly interesting, is that very rarely anything is spoken about question formulation or survey design. These, however, have much greater significance for accurate results than the amount of respondents. I will probably write more about this topic later on. Also the representativeness of the respondents and the population size is commonly ignored. Studies can be found where the amount of respondents even exceed the relevant target group size. When questions that are relevant for marketing decision makers, there is just no sense in targeting the survey to anyone somehow involved with the marketing function just to get more respondents.
Conclusion
My simple hint to a researcher who wants relevant results: focus more on what questions you ask, how you ask them and who is responding your survey than how many respondents you manage to lure. Accurate targeting also reduces people's perceived "burden of questionnaires" and in the long term will improve all of our chances to get answers to questions we feel are important.
Written by Petteri Pohto
Research Director, M.Sc. (Econ.)
Scan Survey Service
Friday, 22 October 2010
Friday, 9 July 2010
How can I prevent emails from getting caught by junkmail filters?
A quick guide for creating a good email template
When a new email message arrives, both email servers and email programs conduct several tests, on which they base their assumptions on whether the email is spam or not.
For example the widely used SpamAssassin method conducts almost 750 tests for each structure, content and sending information for each single message. For every failed test SpamAssassin assigns a certain amount of points, and when the sum reaches the alert level the message is classed as junkmail. Quite often even “real” emails end up in the junkmail folder specifically because of the structure and contents of the email.
In this article we will review the six most typical problems and the solutions to them.
Problem 1: Special characters in the email subjectThe highway to the junkmail folder is using numerous and repeated non letter characters, such as !?#€$%&(){[]}, in your email subject line.
Solution: Stick to text and only use necessary punctuation, such as commas and period marks. Avoid exclamation points and do not use currency symbols, such as £, € or $ - these you can easily replace with words (”pounds”, “euros”, "dollars”).
Problem 2: Low amount of text in relation to picture area
Junkmail filters are very critical of messages that contain very small amounts of text or when the amount of text is small compared to the area of the pictures you have used. Quite often this happens when trying to present the message of the email partly or fully in picture format.
Solution: Most of the contents should be typed in as text. Make a habit of using pictures only as graphic elements – do not put your main message in the pictures.
Problem 3: High numbers of line breaks in relation to the amount of text
In case your email contains a small amount of text but numerous line breaks, the spamfilter might suspect that you are trying to hide something towards the bottom of the email.
Eg. If your message contains only one line; ”Please answer this survey” and a link to a online questionnaire at the end, you should not put in lots and lots of line breaks in between.
Solution: In case your email does not contain lots of text, remember to keep an eye on the number of line breaks. Increase the amount of text slightly (this will most likely also raise your response rate!) Or simply delete unnecessary line breaks.
Problem 4: Links that seem to direct to other addresses than you see on the screen.
Your message is one step closer to junkmail if you have tried to make the message text look better by masking the URLs it contain as a link that is different from the actual destination.The problem occurs when the text visible to the respondent is e.g. www.acme.co.uk/survey, when in fact the URL leads to www.acme.com/AcmeuksurveyAugust2010
Solution: Never show a link as a diferent address than the actual URL is, instead use words, suchas as “Click here” or “Enter our website here”. Of course you can always choose to show the link in its original form.
Problem 5: Text with small font size & colours close to the background colour
This problem is common when unsubscribe link and respondent source information are tried to be made as unnoticeable as possible and then placed at the bottom of the email.
Solution: Do not use the smallest font size and avoid text colours that are close to the background color. Even with large font sizes junkmail fiters will regard your message as suspicious if the text colour is too close to the background colour, i.e. it thinks you are trying to hide something in the message.
Problem 6: Non-standard or badly written HTML code
In general, junkmailfilters are very doubtful towards messages that contain non-standard HTML code. The problem often occurs when writing an email template manually or using external editors. Even if a message created in an external editor looks good in the browser, it does not mean that the code is on all accounts good enough. This is because most browsers are optimized to show poorly written pages as well as possible.
Solution: If you create an email template manually, or using an external editor, it is always worth letting the Webropol ABC editor check the text. Copy the message in html mode to the Email message field, click on the ABC editor to open it and save. The Webropol editor will save the message structure in the best possible form.
When a new email message arrives, both email servers and email programs conduct several tests, on which they base their assumptions on whether the email is spam or not.
For example the widely used SpamAssassin method conducts almost 750 tests for each structure, content and sending information for each single message. For every failed test SpamAssassin assigns a certain amount of points, and when the sum reaches the alert level the message is classed as junkmail. Quite often even “real” emails end up in the junkmail folder specifically because of the structure and contents of the email.
In this article we will review the six most typical problems and the solutions to them.
Problem 1: Special characters in the email subjectThe highway to the junkmail folder is using numerous and repeated non letter characters, such as !?#€$%&(){[]}, in your email subject line.
Solution: Stick to text and only use necessary punctuation, such as commas and period marks. Avoid exclamation points and do not use currency symbols, such as £, € or $ - these you can easily replace with words (”pounds”, “euros”, "dollars”).
Problem 2: Low amount of text in relation to picture area
Junkmail filters are very critical of messages that contain very small amounts of text or when the amount of text is small compared to the area of the pictures you have used. Quite often this happens when trying to present the message of the email partly or fully in picture format.
Solution: Most of the contents should be typed in as text. Make a habit of using pictures only as graphic elements – do not put your main message in the pictures.
Problem 3: High numbers of line breaks in relation to the amount of text
In case your email contains a small amount of text but numerous line breaks, the spamfilter might suspect that you are trying to hide something towards the bottom of the email.
Eg. If your message contains only one line; ”Please answer this survey” and a link to a online questionnaire at the end, you should not put in lots and lots of line breaks in between.
Solution: In case your email does not contain lots of text, remember to keep an eye on the number of line breaks. Increase the amount of text slightly (this will most likely also raise your response rate!) Or simply delete unnecessary line breaks.
Problem 4: Links that seem to direct to other addresses than you see on the screen.
Your message is one step closer to junkmail if you have tried to make the message text look better by masking the URLs it contain as a link that is different from the actual destination.The problem occurs when the text visible to the respondent is e.g. www.acme.co.uk/survey, when in fact the URL leads to www.acme.com/AcmeuksurveyAugust2010
Solution: Never show a link as a diferent address than the actual URL is, instead use words, suchas as “Click here” or “Enter our website here”. Of course you can always choose to show the link in its original form.
Problem 5: Text with small font size & colours close to the background colour
This problem is common when unsubscribe link and respondent source information are tried to be made as unnoticeable as possible and then placed at the bottom of the email.
Solution: Do not use the smallest font size and avoid text colours that are close to the background color. Even with large font sizes junkmail fiters will regard your message as suspicious if the text colour is too close to the background colour, i.e. it thinks you are trying to hide something in the message.
Problem 6: Non-standard or badly written HTML code
In general, junkmailfilters are very doubtful towards messages that contain non-standard HTML code. The problem often occurs when writing an email template manually or using external editors. Even if a message created in an external editor looks good in the browser, it does not mean that the code is on all accounts good enough. This is because most browsers are optimized to show poorly written pages as well as possible.
Solution: If you create an email template manually, or using an external editor, it is always worth letting the Webropol ABC editor check the text. Copy the message in html mode to the Email message field, click on the ABC editor to open it and save. The Webropol editor will save the message structure in the best possible form.
Friday, 26 March 2010
A small case study: How to get followers on social media
As many marketers out there are still trying to figure out social media and how to grow their fanbase on Facebook, we thought we would share this story with you.
In July 2009 Mr Tapio Junes started a group, or a "cause", on Facebook against drunk driving. With very little effort his cause had virally spread to reach 42.000 followers in March 2010.
Starting the spread
In July 2009 Mr Junes started by googling the web for facts and statistics about drunk driving. He posted these on his Facebook “Cause page”. Tapio sent a message to his friends in Facebook. The message was simply a comment about these facts, “Are you annoyed by this too?” The spreading really took off when he started posting news items, video clips and statistics about drunk driving. He never actually sent direct messages to the followers, he emphasises that catchy news on group’s Wall is enough to get followers work for the common purpose.
Maintaining the growth
On a typical day 20 to 60 new followers join the cause, and statistics in Facebook show that many of these instantly attract 1 to 2 additional new members. All Mr Junes does anymore is post a new news items and related videos on the group wall every now and then but the viral spread is continuing. As this is a topic that engages many people it has also spurred active commenting on the pages.
So, let’s summarize what we learned from this case:
1. Start the spread with a short core argument to existing contacts. Make sure it has some news value to make it interesting and credible
2. If possible, support your messages visually. Choose images that have a similar impact as your core argument.
3. Be active and give members a reason to be active and keep coming back: The best reason to be is frequent and interesting updates, so look for interesting sources and always introduce your material by describing links. A great method for writing relevant descriptions is to simply ask yourself “why am I posting this link”.
4. Let the group members take care of inviting people, this occurs if you manage to keep the pages interesting and up to date.
5. Don’t “spam” people with messages, people do not like huge amounts of messages from the group owner
6. Celebrate growth of the group by thanking when you reach milestone numbers!
PS. (For your reference, the Finnish Anti Drink driving group can be found in Facebook on: http://apps.facebook.com/causes/108740 )
In July 2009 Mr Tapio Junes started a group, or a "cause", on Facebook against drunk driving. With very little effort his cause had virally spread to reach 42.000 followers in March 2010.
Starting the spread
In July 2009 Mr Junes started by googling the web for facts and statistics about drunk driving. He posted these on his Facebook “Cause page”. Tapio sent a message to his friends in Facebook. The message was simply a comment about these facts, “Are you annoyed by this too?” The spreading really took off when he started posting news items, video clips and statistics about drunk driving. He never actually sent direct messages to the followers, he emphasises that catchy news on group’s Wall is enough to get followers work for the common purpose.
Maintaining the growth
On a typical day 20 to 60 new followers join the cause, and statistics in Facebook show that many of these instantly attract 1 to 2 additional new members. All Mr Junes does anymore is post a new news items and related videos on the group wall every now and then but the viral spread is continuing. As this is a topic that engages many people it has also spurred active commenting on the pages.
So, let’s summarize what we learned from this case:
1. Start the spread with a short core argument to existing contacts. Make sure it has some news value to make it interesting and credible
2. If possible, support your messages visually. Choose images that have a similar impact as your core argument.
3. Be active and give members a reason to be active and keep coming back: The best reason to be is frequent and interesting updates, so look for interesting sources and always introduce your material by describing links. A great method for writing relevant descriptions is to simply ask yourself “why am I posting this link”.
4. Let the group members take care of inviting people, this occurs if you manage to keep the pages interesting and up to date.
5. Don’t “spam” people with messages, people do not like huge amounts of messages from the group owner
6. Celebrate growth of the group by thanking when you reach milestone numbers!
PS. (For your reference, the Finnish Anti Drink driving group can be found in Facebook on: http://apps.facebook.com/causes/108740 )
Monday, 7 December 2009
Webropol brings Text Mining to its online survey software
 We have some exciting news for you! As first in the world, Webropol brings Text Mining capabilities to online survey software. Working as part of the Webropol toolset, the Text Mining solution allows for analysis, classification and grouping of textual answers based on occurring themes, keywords and respondent background data. Thanks to this toolset organisations can now process and analyse unstructured survey data more quickly, thoroughly, and objectively than ever before.
”It is unfortunate how often one runs into situations where managers would like to ask customers for free feedback, but will not do so in the fear of having to read sheet after sheet of answers. The Text Mining solution opens up completely new ways to use unstructured data for business intelligence purposes when hours worth of manual work is done in minutes.”, says UK Country Manager Mukesh Bassi from Webropol.
By comparing textual answers based on other responses and on background data managers get an insight into how feedback, suggestions, and ideas vary depending on e.g. employee satisfaction or customer life cycle. This will also help organisations set up and fine-tune their numeric customer and employee metrics to measure the things that are the most relevant.
”The Text Mining solution suits excellently both short surveys, and more complex research, especially when you are asking respondents for their ideas, feedback, or advice. It is virtually impossible to collect all ideas unless you gather answers in free form”, Mukesh points out.
The Text Mining solution works as part of the Webropol survey software, but data can be brought for analysis from external sources as well.
More information:
Mr. Mukesh Bassi
UK Country Manager, Webropol
telephone +44 (0) 24 7632 3229
email: firstname.lastname@webropol.com
Wednesday, 25 November 2009
Reach the world with viral surveys on Facebook
In our last blog post we discussed the possibilities of virally spread surveys in social media. After posting it we got some questions from people asking how they should go about to make the most of the fan pages they have on Facebook. For this we put together a video called ”Reach the world with viral surveys on Facebook”. Enjoy!
What’s the next step?
If you’re already using the Webropol survey software you can start sharing surveys on Facebook right away! Any survey created can be shared with fans and friends using the application. If you’re not using the Webropol survey software yet, you can start by making free and ad-free polls with the Facebook application.
Grab the application for free at http://apps.facebook.com/webropol
If you're interested in hearing more about the possibilities of virally spread Facebook surveys, don't hesitate to contact us! Also be sure to visit our Facebook fan page for more news and information!
Ps. If you for some reason cannot access the video above, it’s also available on Youtube.
What’s the next step?
If you’re already using the Webropol survey software you can start sharing surveys on Facebook right away! Any survey created can be shared with fans and friends using the application. If you’re not using the Webropol survey software yet, you can start by making free and ad-free polls with the Facebook application.
Grab the application for free at http://apps.facebook.com/webropol
If you're interested in hearing more about the possibilities of virally spread Facebook surveys, don't hesitate to contact us! Also be sure to visit our Facebook fan page for more news and information!
Ps. If you for some reason cannot access the video above, it’s also available on Youtube.
Tuesday, 3 November 2009
Online viral surveys on Facebook
OR: How you turn 200 fans into a million responses at zero cost
We’re very excited to present a solution that will change online surveys forever. The new Facebook application from Webropol allows for viral spreading of surveys. This means you can harness the force of social media for product development, idea generation, feedback, and virtually any other kind of surveys. The application will help you turn 200 respondents into a million responses – at virtually no cost!
To be honest with you, even we think it’s quite a bold statement to say that you can somehow turn 200 people into a million responses. That’s why we start this blog post by putting our money where our mouth is.
Let’s say you have a modest Facebook fan base of 200 people and you send out a message with an online survey link attached. A response rate of 25% you will get you 50 responses. However a good result this is, it’s not using nearly the full potential of social media nor nearly reaching all 300 million Facebook users. What if you could somehow reach the friends of the respondents and the friends of those, and the friends of those...?
The force of viral spread
The average user of Facebook has 130 friends. This where the WEBROPOL application begins: when a person responds to a survey, she can show it on her news feed for her friends to see. When you factor in that 130 friends of each of the fifty who responded see the survey, you reach an additional 6500 pair of eyes. And if just a modest 5% of those take the sur vey, you have 375 responses more. Once again, the friends of those who responded see the survey in the news feed and answer. At just three steps from the original respondents, you could have tens of thousands responses.
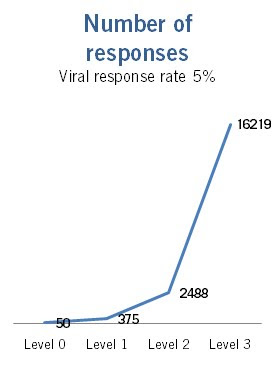

Should your viral response rate hit as high as 20 per cent, you would get a staggering million answers with just three levels!
How does it work?
Using the WEBROPOL application is a no-brainer. You simply create a normal survey and paste its link into the application. Then you go to your Fan Page and send an update to fans. There you can even target the recipients based on location, age and gender. Just click ”send” and wait for the responses to drop in!
Free to use and no ads!
The WEBROPOL application is 100% ad-free: there are no annoying ads, no pop-ups and no intrusive messages. It’s also worth mentioning that no information is passed on to any 3rd party. The application is absolutely free to use and there are no separate licence fees or hidden charges.
If you you’re not using the Webropol online survey software yet, you can still create simple polls with the Facebook application. Then just click ”Polls” and send out a poll to your friends!
Try out the Facebook application right away!
Glossary & Frequently Asked Questions
What’s a Facebook Fan Page?
In Facebook’s own words, a Fan Page is ” a public profile that enables you to share your business and products with Facebook users. When your fans interact with your Facebook Page, stories linking to your Page can go to their friends via News Feed. As these friends interact with your Page, News Feed keeps driving word-of-mouth to a wider circle of friends.” It’s completely free to set up and operate a fan page even for commercial purposes!
Just to get an idea of different fan pages, have a look at these: Coca-Cola, Pringles, Nokia, Webropol.
How many people are on Facebook?
According to Facebook its users have on average 130 friends. The number of Facebook users amount to over 300 million spread world-wide. Every day more than 8 billion minutes are spent in Facebook. For more information, see the Facebook statistics page.
We’re very excited to present a solution that will change online surveys forever. The new Facebook application from Webropol allows for viral spreading of surveys. This means you can harness the force of social media for product development, idea generation, feedback, and virtually any other kind of surveys. The application will help you turn 200 respondents into a million responses – at virtually no cost!
To be honest with you, even we think it’s quite a bold statement to say that you can somehow turn 200 people into a million responses. That’s why we start this blog post by putting our money where our mouth is.
Let’s say you have a modest Facebook fan base of 200 people and you send out a message with an online survey link attached. A response rate of 25% you will get you 50 responses. However a good result this is, it’s not using nearly the full potential of social media nor nearly reaching all 300 million Facebook users. What if you could somehow reach the friends of the respondents and the friends of those, and the friends of those...?
The force of viral spread
The average user of Facebook has 130 friends. This where the WEBROPOL application begins: when a person responds to a survey, she can show it on her news feed for her friends to see. When you factor in that 130 friends of each of the fifty who responded see the survey, you reach an additional 6500 pair of eyes. And if just a modest 5% of those take the sur vey, you have 375 responses more. Once again, the friends of those who responded see the survey in the news feed and answer. At just three steps from the original respondents, you could have tens of thousands responses.


Should your viral response rate hit as high as 20 per cent, you would get a staggering million answers with just three levels!
How does it work?
Using the WEBROPOL application is a no-brainer. You simply create a normal survey and paste its link into the application. Then you go to your Fan Page and send an update to fans. There you can even target the recipients based on location, age and gender. Just click ”send” and wait for the responses to drop in!
Free to use and no ads!
The WEBROPOL application is 100% ad-free: there are no annoying ads, no pop-ups and no intrusive messages. It’s also worth mentioning that no information is passed on to any 3rd party. The application is absolutely free to use and there are no separate licence fees or hidden charges.
If you you’re not using the Webropol online survey software yet, you can still create simple polls with the Facebook application. Then just click ”Polls” and send out a poll to your friends!
Try out the Facebook application right away!
Glossary & Frequently Asked Questions
What’s a Facebook Fan Page?
In Facebook’s own words, a Fan Page is ” a public profile that enables you to share your business and products with Facebook users. When your fans interact with your Facebook Page, stories linking to your Page can go to their friends via News Feed. As these friends interact with your Page, News Feed keeps driving word-of-mouth to a wider circle of friends.” It’s completely free to set up and operate a fan page even for commercial purposes!
Just to get an idea of different fan pages, have a look at these: Coca-Cola, Pringles, Nokia, Webropol.
How many people are on Facebook?
According to Facebook its users have on average 130 friends. The number of Facebook users amount to over 300 million spread world-wide. Every day more than 8 billion minutes are spent in Facebook. For more information, see the Facebook statistics page.
Thursday, 15 October 2009
Create your own customer metrics easily
 Thanks to the computer age information has become so abundant that managers are having a hard time staying up to date and in focus on how the daily business is doing. That’s where metrics come into the picture. They provide a quick and reliable acid test to help us know where we are going and how fast we are getting there.
Deciding on which metrics to use, however, can be tricky. Textbook examples might prove a bit too theoretical. At the same time metrics based on gut feeling might be unreliable. A good approach is to set up customer metrics with the help of the customers themselves. In the following we discuss a very efficient way to create metrics that are both reliable and valid.
Coming up with your metrics
Say you want to have people rate their “customer experience” when they visited your store. Surely you couldn’t ask people to do so on a scale from 1 to 5, since it’s hard for people to understand the question and people would consider lots of different things when giving the rating. Needless to say it will result in low validity (the question isn’t measuring what it’s supposed to) and low reliability (the results will vary depending on who gives the answer). If you wanted to make a scale question with separate components (such as store cleanliness, customer service, product range, etc), which ones would you choose out of potentially millions of things?
Instead you should start out with a pilot survey intended to (now we’re using fancy research jargon) operationalize the concept. In plain terms it means that you try to find out which the things are that contribute to and make up the experience of visiting your shop. Once that’s clear, you can create a metric that’s measuring what it’s supposed to.
Setting up and fine-tuning the concept
Now you want to find out which things affect customer experience positively and negatively. The best thing to do this is to run a pilot study with two open-ended questions:
“When visiting our shop, what things did you find positive?”
“When visiting our shop, what things did you find negative?”
Do the pilot study and have people pour their hearts out. Run both questions on text mining software (such as that of Webropol) and find the biggest topics from both questions. There you have it – those are the things you should have your customers rate!
Say you get 10 things that are talked about a lot. Then you make a scale question where people are asked to rate these ten things. The sum of these will be the “customer experience” you were looking for in the first place. Then you can do the actual survey with this scale question.
Wait! There’s more than just the metric!
Once you’ve completed your pilot study you have actually got a lot of interesting information besides the metric. What you just did is that you:
a) Found out which things your customer experience is made up of
b) Found out which things add to or subtract from the experience (remember, you asked positive and negative things separately in the pilot study!)
c) Quantified your experience concept, i.e. you now have a numerical tool to use. This allows for studying customer experience trends over time, compare different customer segments, stores visited etc.
d) You have quantified the sub-components (e.g. product range) that contribute to the experience. You can also study these over time or between segments, stores etc.
For more information on text analytics and text mining, please contact us! Don't forget to visit our website!
Subscribe to:
Posts (Atom)