Showing posts with label online survey software. Show all posts

Wednesday, 25 November 2009

Reach the world with viral surveys on Facebook

In our last blog post we discussed the possibilities of virally spread surveys in social media. After posting it we got some questions from people asking how they should go about to make the most of the fan pages they have on Facebook. For this we put together a video called ”Reach the world with viral surveys on Facebook”. Enjoy!


What’s the next step?
If you’re already using the Webropol survey software you can start sharing surveys on Facebook right away! Any survey created can be shared with fans and friends using the application. If you’re not using the Webropol survey software yet, you can start by making free and ad-free polls with the Facebook application.

Grab the application for free at http://apps.facebook.com/webropol

If you're interested in hearing more about the possibilities of virally spread Facebook surveys, don't hesitate to contact us! Also be sure to visit our Facebook fan page for more news and information!


Ps. If you for some reason cannot access the video above, it’s also available on Youtube.

Tuesday, 3 November 2009

Online viral surveys on Facebook

OR: How you turn 200 fans into a million responses at zero cost

We’re very excited to present a solution that will change online surveys forever. The new Facebook application from Webropol allows for viral spreading of surveys. This means you can harness the force of social media for product development, idea generation, feedback, and virtually any other kind of surveys. The application will help you turn 200 respondents into a million responses – at virtually no cost!

To be honest with you, even we think it’s quite a bold statement to say that you can somehow turn 200 people into a million responses. That’s why we start this blog post by putting our money where our mouth is.

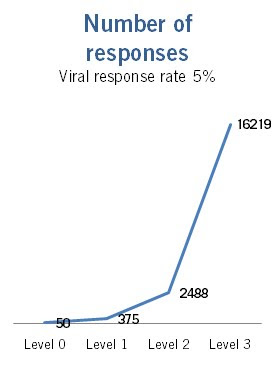
Let’s say you have a modest Facebook fan base of 200 people and you send out a message with an online survey link attached. A response rate of 25% you will get you 50 responses. However a good result this is, it’s not using nearly the full potential of social media nor nearly reaching all 300 million Facebook users. What if you could somehow reach the friends of the respondents and the friends of those, and the friends of those...?


The force of viral spread
The average user of Facebook has 130 friends. This where the WEBROPOL application begins: when a person responds to a survey, she can show it on her news feed for her friends to see. When you factor in that 130 friends of each of the fifty who responded see the survey, you reach an additional 6500 pair of eyes. And if just a modest 5% of those take the sur vey, you have 375 responses more. Once again, the friends of those who responded see the survey in the news feed and answer. At just three steps from the original respondents, you could have tens of thousands responses.

Online viral surveys on FacebookOnline viral surveys on Facebook


Should your viral response rate hit as high as 20 per cent, you would get a staggering million answers with just three levels!


How does it work?
Using the WEBROPOL application is a no-brainer. You simply create a normal survey and paste its link into the application. Then you go to your Fan Page and send an update to fans. There you can even target the recipients based on location, age and gender. Just click ”send” and wait for the responses to drop in!


Free to use and no ads!
The WEBROPOL application is 100% ad-free: there are no annoying ads, no pop-ups and no intrusive messages. It’s also worth mentioning that no information is passed on to any 3rd party. The application is absolutely free to use and there are no separate licence fees or hidden charges.

If you you’re not using the Webropol online survey software yet, you can still create simple polls with the Facebook application. Then just click ”Polls” and send out a poll to your friends!

Try out the Facebook application right away!


Glossary & Frequently Asked Questions

What’s a Facebook Fan Page?
In Facebook’s own words, a Fan Page is ” a public profile that enables you to share your business and products with Facebook users. When your fans interact with your Facebook Page, stories linking to your Page can go to their friends via News Feed. As these friends interact with your Page, News Feed keeps driving word-of-mouth to a wider circle of friends.” It’s completely free to set up and operate a fan page even for commercial purposes!

Just to get an idea of different fan pages, have a look at these: Coca-Cola, Pringles, Nokia, Webropol.

How many people are on Facebook?
According to Facebook its users have on average 130 friends. The number of Facebook users amount to over 300 million spread world-wide. Every day more than 8 billion minutes are spent in Facebook. For more information, see the Facebook statistics page.

Thursday, 15 October 2009

Create your own customer metrics easily

online survey softwareThanks to the computer age information has become so abundant that managers are having a hard time staying up to date and in focus on how the daily business is doing. That’s where metrics come into the picture. They provide a quick and reliable acid test to help us know where we are going and how fast we are getting there.

Deciding on which metrics to use, however, can be tricky. Textbook examples might prove a bit too theoretical. At the same time metrics based on gut feeling might be unreliable. A good approach is to set up customer metrics with the help of the customers themselves. In the following we discuss a very efficient way to create metrics that are both reliable and valid.


Coming up with your metrics

Say you want to have people rate their “customer experience” when they visited your store. Surely you couldn’t ask people to do so on a scale from 1 to 5, since it’s hard for people to understand the question and people would consider lots of different things when giving the rating. Needless to say it will result in low validity (the question isn’t measuring what it’s supposed to) and low reliability (the results will vary depending on who gives the answer). If you wanted to make a scale question with separate components (such as store cleanliness, customer service, product range, etc), which ones would you choose out of potentially millions of things?

Instead you should start out with a pilot survey intended to (now we’re using fancy research jargon) operationalize the concept. In plain terms it means that you try to find out which the things are that contribute to and make up the experience of visiting your shop. Once that’s clear, you can create a metric that’s measuring what it’s supposed to.


Setting up and fine-tuning the concept

Now you want to find out which things affect customer experience positively and negatively. The best thing to do this is to run a pilot study with two open-ended questions:

“When visiting our shop, what things did you find positive?”
“When visiting our shop, what things did you find negative?”

Do the pilot study and have people pour their hearts out. Run both questions on text mining software (such as that of Webropol) and find the biggest topics from both questions. There you have it – those are the things you should have your customers rate!

Say you get 10 things that are talked about a lot. Then you make a scale question where people are asked to rate these ten things. The sum of these will be the “customer experience” you were looking for in the first place. Then you can do the actual survey with this scale question.


Wait! There’s more than just the metric!

Once you’ve completed your pilot study you have actually got a lot of interesting information besides the metric. What you just did is that you:

a) Found out which things your customer experience is made up of
b) Found out which things add to or subtract from the experience (remember, you asked positive and negative things separately in the pilot study!)
c) Quantified your experience concept, i.e. you now have a numerical tool to use. This allows for studying customer experience trends over time, compare different customer segments, stores visited etc.
d) You have quantified the sub-components (e.g. product range) that contribute to the experience. You can also study these over time or between segments, stores etc.


For more information on text analytics and text mining, please contact us! Don't forget to visit our website!